Solar-powered space flight
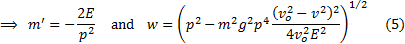
3d. Power required to reach earth orbit
ignoring atmospheric drag: Assuming that we launch approximately
‘horizontally’, with capped variable exhaust velocity
[this page | pdf | references | back links]
Return to Abstract
and Contents
Next page
3.10 More
plausible, for reasons set out later, would be to place an upper limit on the
propellant ejection velocity of circa  = 10,000 ms-1.
The optimal approach is as above until this ejection speed is reached.
Thereafter you would again choose
= 10,000 ms-1.
The optimal approach is as above until this ejection speed is reached.
Thereafter you would again choose  to maximise
  , so:
, so:

Flight metrics for
various ratios of  using this approach
are in Table 4. In such a trajectory,
using this approach
are in Table 4. In such a trajectory, 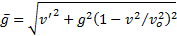 is the effective
thrust acceleration experienced by the vehicle. This acceleration is relatively
modest in relation to that typically applicable to chemical powered rocketry
(although much higher than for previously suggested solar-powered vehicles). If
= 10 kW/kg then
is the effective
thrust acceleration experienced by the vehicle. This acceleration is relatively
modest in relation to that typically applicable to chemical powered rocketry
(although much higher than for previously suggested solar-powered vehicles). If
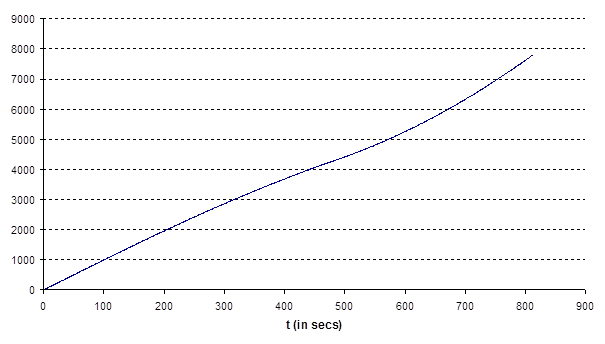
= 10 kW/kg then  starts at
  , falls to
approximately
, falls to
approximately  somewhat after
half-way through the flight into orbit, and then increases again to about
somewhat after
half-way through the flight into orbit, and then increases again to about  when
orbital velocity is reached, see Figure 4. Once the propellant ejection speed
reaches its upper limit, the optimal ejection angle ceases to be 45° to the
vertical and changes (seemingly uniformly through time) until it becomes
horizontal when orbit is reached. In practice, it may be preferable to continue
to eject propellant in a direction opposite to that of the sun, see later.
Given the relatively short flight time involved this would imply an
approximately constant ejection angle throughout flight, which if adopted would
increase modestly the required power per unit lifted mass, but would also
result in a somewhat higher initial orbit.
when
orbital velocity is reached, see Figure 4. Once the propellant ejection speed
reaches its upper limit, the optimal ejection angle ceases to be 45° to the
vertical and changes (seemingly uniformly through time) until it becomes
horizontal when orbit is reached. In practice, it may be preferable to continue
to eject propellant in a direction opposite to that of the sun, see later.
Given the relatively short flight time involved this would imply an
approximately constant ejection angle throughout flight, which if adopted would
increase modestly the required power per unit lifted mass, but would also
result in a somewhat higher initial orbit.
Table 4. Flight
characteristics to reach orbit for a range of  , if propellant is
ejected at optimal speeds (subject to an upper limit of 10,000 ms-1)
and the vehicle travels horizontally
, if propellant is
ejected at optimal speeds (subject to an upper limit of 10,000 ms-1)
and the vehicle travels horizontally
|
 (kW/kg) (kW/kg)
|
Ratio of propellant
to lifted mass
|
 (kW
per kg lifted mass) (kW
per kg lifted mass)
|
Flight time to
reach orbital velocity (s)
|
Maximum acceleration
ms-2
|
|
100
|
1.3
|
227
|
280
|
45
|
|
50
|
1.6
|
131
|
540
|
26
|
|
30
|
2.3
|
100
|
669
|
20
|
|
15
|
4.2
|
79
|
774
|
16
|
|
10
|
6.2
|
72
|
813
|
14
|
|
8
|
7.7
|
69
|
829
|
14
|
|
6
|
10.1
|
67
|
845
|
13
|
Figure 4. Plot of
vehicle velocity and mass as a function of time, if propellant ejected at
optimal speeds (subject to an upper limit of 10,000ms-1) and angles
to the vertical, if = 10 kW/kg
NAVIGATION LINKS
Contents | Prev | Next